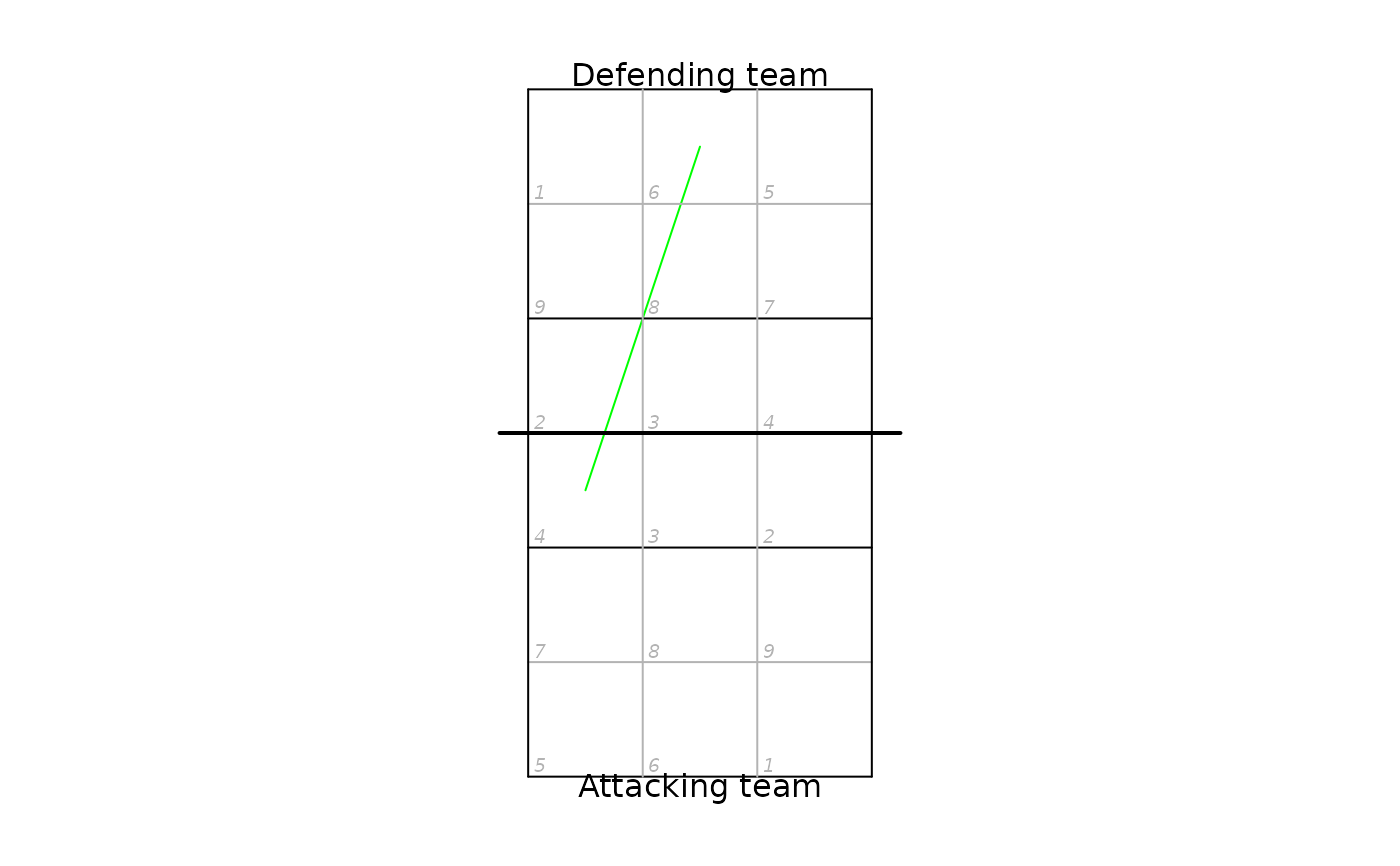
The plot will be set up as either a full- or half-court plot, depending on the inputs. The extent can be specified via the court argument (values either "full", "lower", or "upper"), or via the x and y arguments. If the latter, provide either separate x and y numeric vectors, or as a single x RasterLayer object. If no extent is specified by any of these methods, a full-court plot is assumed.
Arguments
- x
numeric or RasterLayer: x-coordinates of the data to plot, or a
RasterLayerlayer defining the extent of the data- y
numeric: y-coordinates of the data to plot. Not needed if
xis aRasterLayerobject- legend
logical: if
TRUE, leave space for a legend- court
string: either "full", "lower", or "upper"
- margins
numeric: vector of four values to use as margins (bottom, left, top, right). Values are as a proportion of the plot size
- par_args
list: parameters to pass to
par- ...
: additional parameters passed to
plot.window

